Real-Time Gross Management
Track total gross, front-end gross, back-end gross, and gross per unit as deals are delivered throughout the month.

Real‑time visibility into gross profit, discount discipline, pipeline health and team accountability — so you stop bleeding margin and start hitting targets every day.
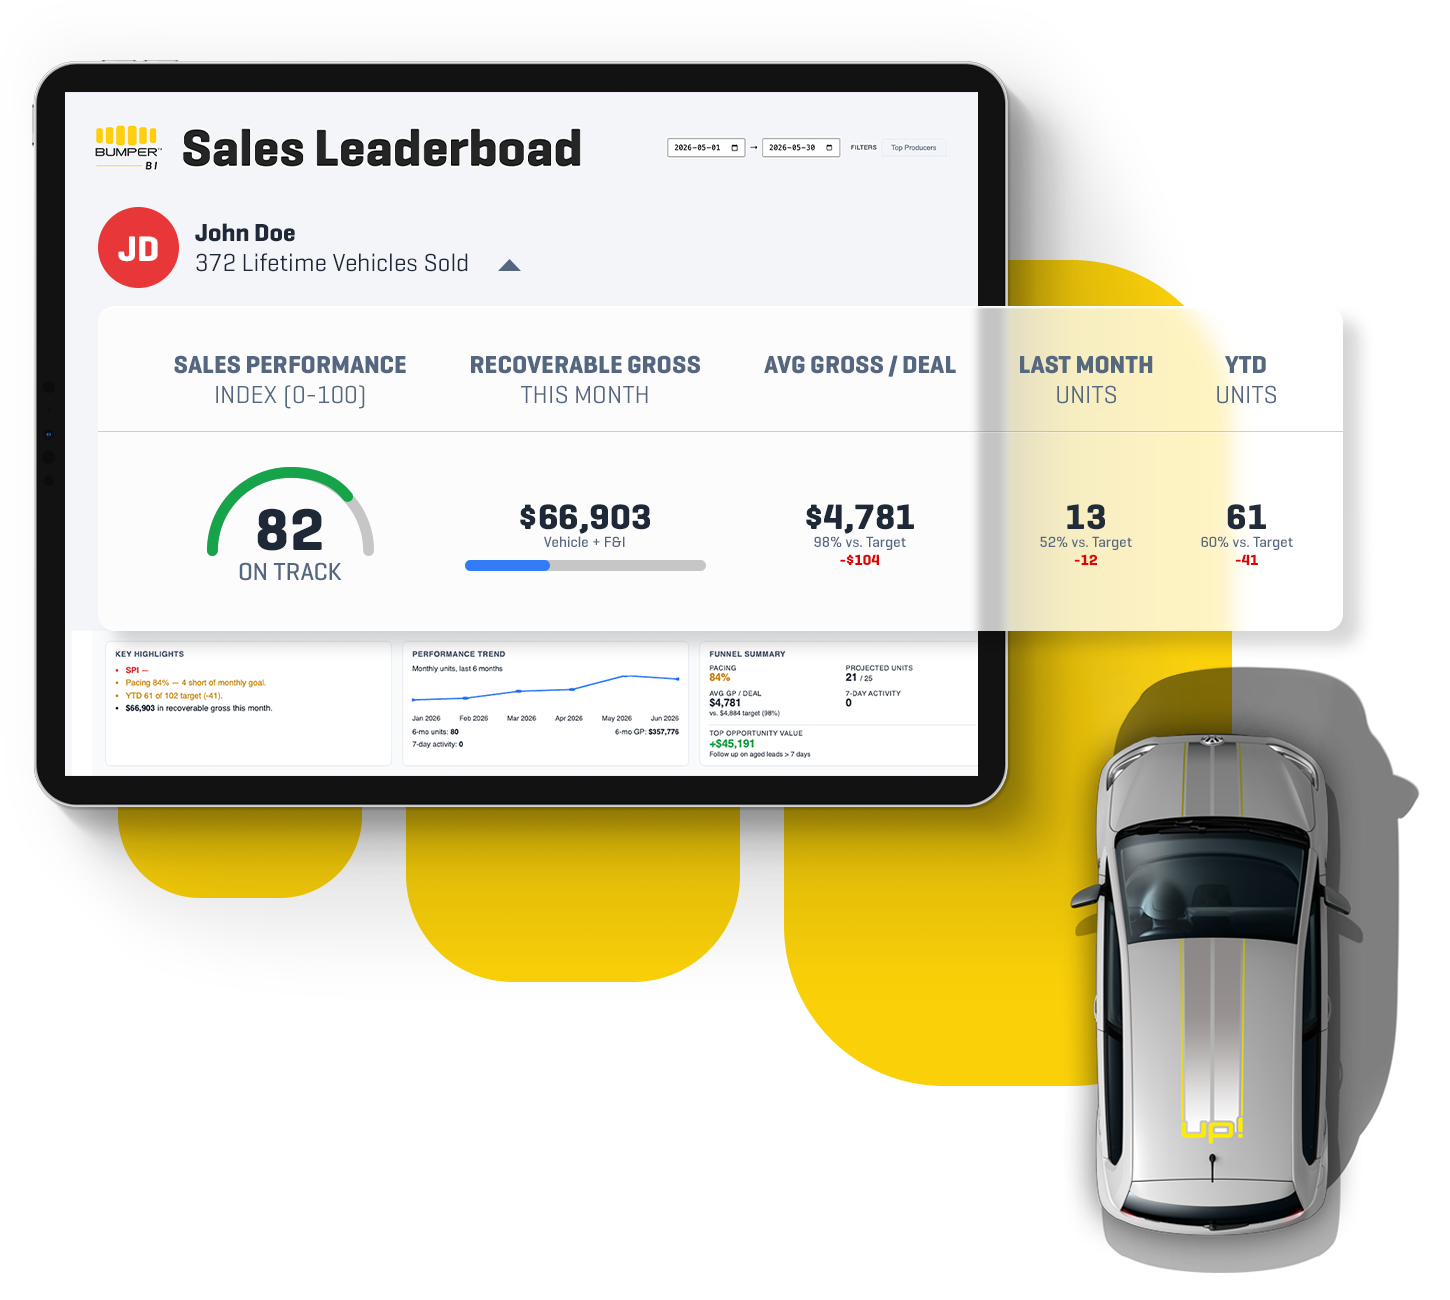
Bumper BI doesn't just show you sales numbers — it shows you where money is made and lost in real time. See gross per unit and per deal as it happens, spot discounting patterns before they kill your front end, monitor each manager and salesperson against targets, and track active deals through every stage.
Key Capabilities
Track total gross, front-end gross, back-end gross, and gross per unit as deals are delivered throughout the month.
Identify aging inventory, monitor inventory turn, and understand which vehicles are driving profit and which are slowing growth.
Monitor sales pace, projected month-end results, and performance against targets before month-end surprises occur.
Compare salespeople by units, gross, closing performance, activity, and targets to identify coaching opportunities quickly.
Total Gross Profit
$1,346,576+15.4% vs YesterdayGross Profit / Unit
$1,845+6.2% vs YesterdayUnits Sold
142+10.8% vs YesterdayAvg. Front End
$4,231+5.2% vs YesterdayMonth-end Forecast
28.6%+1.4% vs YesterdayTurn daily sales movement into decisions before the month is gone.
Catch margin leaks, stuck deals, and team drift while they can still be fixed.
Give managers a clear operating rhythm for protecting gross every day.